GET STARTED 

Question about a feature?


Get in touch with one of our solutions experts to get your questions answered or schedule a short demo and see how quickly we can unify your data.

OR

Envision Dashboard Apps -

Visualize your data

Easily create customizable dashboards without any coding requirements and gain new insights into your project from planning to testing and completion.

Project Intelligence

From start to finish

Revolutionize your data visualization and analysis across all project stages with our comprehensive Envision Dashboard App collection.


Empower yourself with the ability to unlock the true potential of your data, from project initiation to completion.

A Library of pre-built apps.

We have a fine-tuned battle tested pre-built applications for every stage of your project.


We’ve split the Envision Dashboard Apps into 4 packages:

1

Project and Program Management

Now you can utilize data from legacy schemas including the DoD IPMR and IPMDAR to provide a comprehensive EVM, GEAC, and Schedule capability.


Included Applications

IPPM Applications Suite Library

Utilizes data from legacy schemas including the DoD IPMR and IPMDAR to provide a comprehensive EVM, Schedule, and Risk analysis capability.

  • Filter by role:
  • Compliance Management
  • Executive Management
  • Program Management Teams
  • Analyst: Risk
  • Analyst: Schedule
Supplemental EVM and Schedule Data Entry
Enables the utilization of risk data for analysis, visualization, and tracking of contingencies at contract level, including comparing EACs, milestone tracking, and providing executive summaries.
Data Maintenance
Special-purpose application for maintaining and validating data in database for IPPM data.
Loaded IPPM Data
Verifies data that is loaded in the database via Grid views and other visualizations to allow for validation and review.
User and Workspace Logging
User and Workspace Logging Records and visualizes Dashboard Application usage by user and aggregate analytics. Also tracks user transactions on the system for audit and accountability.
EVM Child Drivers
Focused application that shows variance trending for an element, it's children and grand children to easily identify cost and schedule EVM variance drivers.
Integrated Project Management
Fully integrates cost and schedule performance metrics and analysis for EVM, GEAC, IMS, and risk information. Provides
Integrated Project Management
Fully integrates cost and schedule performance metrics and analysis for EVM, GEAC, IMS, and risk information. Provides
Advanced Integrated Cost and Schedule Metrics
Delivers advanced cost and schedule blended metrics and analysis for predicting future cost and schedule variances, and to validate and reconcile metrics based on differing bases of calculation for the same systems.
IMS Driving Path
Enables schedule analysis by allowing users to filter driving paths to a selected milestone in the IMS and provides a comprehensive selection of best practice analytical information for use on the IMS.
Schedule Analysis
Visualization of the entire IMS, with features for drill down, schedule tracing, historical trending, performance metrics, reporting and ad hoc visualization and analysis.
Time Phasing Analysis
This integration Dashboard Application visualizes EVM and IMS data to identify inconsistencies and provide insights for proactive project management.
Quick Look IPPM
Delivers focused key cost and schedule performance metrics for a contract. Especially useful for specialized or new personnel, or for initial analysis and validation of early contract deliverables.
Variance Analysis Reporting
Flags variance breaches and allows for Format 5 variance inputs, links to documentation, and full visualization of all aspects of the process.
IPMR Schedule Compare
Highlights schedule changes, tracks undocumented changes, date, duration, logic, code and criticality changes. Useful in tracking undocumented or ad hoc changes that will create erroneous IMS submissions
Time-phasing Compare
Allows the comparison of two time-phased EV data periods, identifying discordant WBS changes and assisting in tracking retroactive changes for consistent planning and execution in cost performance progress calculation and reporting.
PPM Dashboard**
Project, Program and Executive Management.
EVM and Schedule Performance
Reports and visualizes level 1 performance data across projects and programs to easily compare performance, providing data regarding differences among project and program performance, and future planning and execution data.

Advanced IPPM (IPPM/IPMDAR) 

Provides additional functionality to IPPM Repository applications utilizing the greater insight and breadth of data provided by the DoD standard IPMDAR schema.


  • Filter:
  • Envision Dashboard Apps
  • Envision Data Transformer
  • Proteus Integrator
IPMDAR Performance Recalculation and Data Entry
A dashboard application that provides for the recalculation of the data elements needed for the IPMDAR Performance workspace and data entry for contract level auxiliary data including three-point risk.
Baseline Change Control and Review
Flags cost and schedule changes across two periods with drill down by Control Account, Work Package and Task level. Allows for changes tracking and impact analysis.
Program Management Review
Integrates program management metrics, provides flexibility through the IPMDAR schema, and offers customized information based on user roles.
IPMDAR Performance Narrative Report
Facilitates recording and generating an IPMDAR Performance Narrative Report submittal from contract level inputs to WBS/OBS/Control Account breach narratives on impact and corrective actions.
IPMDAR Cost vs. NASA 533/CFSR Financial Analysis
Will generate the NASA 533M and 533Q reports from financial data and earned value IPMDAR data used to reconcile financial execution with cost performance as well as future period planning.

Probabilistic EAC Applications Library

Series of application workspaces that utilize method of moments utilizing statistical modeling of past performance, risk, and SRA results by WBS element to derive a range of estimates at complete/estimates to complete.

  • Filter:
  • Envision Dashboard Apps
  • Envision Data Transformer
  • Proteus Integrator
EAC Probability Setup
Input Dashboard Application for the setup, flagging and coding of the probability function in preparation for the EAC calculation process.
EAC Probability Risk Entry and Review
Allows for the entry and review of risks including probability, impacts and linkages to WBS elements for the probability function. Optional application for Probabilistic EAC functionality.
EAC Probability Calculation
Input/validation workspace app for the probability function.
EAC Probability Analysis
Uses statistical modeling to generate probabilistic EAC and ETC S-Curves for projects, allowing organizations to compare them to the Latest Revised Estimate (LRE) and other estimates for a more comprehensive analysis of project costs.

DCMA DECM Applications Library

Provides functionality for the DCMA EVMS Compliance Metrics system. This functionality leverages all industry and DoD schemas, including the IPMR and IPMDAR files to provide in-depth analysis in support of the DCMA system.

  • Filter by TYPE:
  • Admin
  • Analysis
  • Portfolio
  • Reporting
Recalculation and Loaded Data
Shows the status of imported data for each contract and period end, recalculates the IBR quality checks, provides data maintenance and allows the import of new or corrected data
Test Step Table Manager
Allows the management of the DECM Test Step table and corresponding metadata.
Breakout Reporting
Rolls up DECM trips by entities such as Control Account, Work Package, Time Phasing, Schedule by each Control Account to facilitate reporting and analysis to determine where DECM trips and flags are occurring.
CAM Control Account Pivot
Creates a package of data to assist DCMA or an industry organization with a surveillance and CAM interview environment in one app.
Analysis Data Entry
Provides an input environment for recoding of manual or overridden automated scores, with rationales and other historical analytical functionality.
DECM Details
Integrates the underlying cost and schedule data from which DECM results were derived, showing drill down from contract to control accounts to work packages to tasks to time-phased data and logic links.
DECM Overview
Visualizing the DECM test results for a selected contract and period end, time-phased trending of surveillance history, providing visibility for proactive management for compliance.
Test Record IDs
Provides rapid identification of test steps performed and, of those test step trips with detailed information on the reason for the trip.
DECM Multiple Contracts
Provides a consolidated record of a portfolio of contracts that possess organizational commonalities for macro analysis such as a surveillance review for a program, site and business area.
Format 1 and Format 7
Provides verification of Format 1 or Format 7 data derived from electronically submitted data to compare against hard-copy report submittal.

Schedule Analysis from MS Project Application

Utilizes data from legacy schemas including the DoD IPMR and IPMDAR to provide a comprehensive EVM, Schedule, and Risk analysis capability.

  • Filter:
  • Envision Dashboard Apps
  • Envision Data Transformer
  • Proteus Integrator
Portfolio Schedule Integration and Analysis
Integrates multiple project schedules together for analysis, including ability to set portfolio baseline schedule to track execution against and defining giver/receivers across projects to track variances and margin across handoffs.
Project Analysis
Provides visualization of the entire MS Project schedule, with features for drill down, schedule tracing, historical trending, performance metrics, reporting and ad hoc visualization and analysis.
Schedule Compare
Highlights the changes in the MS Project schedule from one period to another period including date, duration, logic, code and criticality changes. Particularly useful in tracking undocumented or ad hoc changes that will create erroneous IMS submissions for activity and work accomplishment. Also useful in identifying and reconciling retroactive changes.

IBR & Program Data Quality Review Applications

Series of application workspaces that facilitate the preparation for and documentation related to the Integrated Baseline Review (IBR).

Other application workspaces have been deployed in support of the Program Management Review (PMR), Systems Requirements Review (SRR), and the Critical Design Review (CDR). Often combined with specified domain repositories.

  • Filter App TYPE:
  • Admin
  • Analysis
  • IBR Execution
Data Quality Recalculation and Loaded Data
Comprehensive first step administrative Dashboard Application that shows the status of imported data for each contract and period end, recalculates the IBR quality checks, provides data maintenance, and provides a launcher for Envision Data Transformer for the import of new or corrected data.
Data Quality Test Step Table Manager
Allows the management of the IBR Data Quality checks table and corresponding metadata.
Data Quality Breakout Reporting
IBR data quality trips by entities such as Control Account, Work Package, Time Phasing, Schedule by each Control Account to facilitate reporting and analysis to determine where data quality trips are occurring. Purpose-built to facilitate CAM interviews.
Data Quality Overview
Complete review of data quality test steps to support an IBR.
Data Quality Details
Integrates the underlying cost and schedule data and other artifacts linked to test-step results derived from showing drill down from contract to control accounts to tasks to time-phased data and logic links.
Data Quality Data Entry
Provides an input environment for recoding of manual or overridden automated scores, with rationales and other historical analytical functionality.
IBR Execution – CAM Interview
Manage the CAM interviews with supporting EVM and schedule data to record responses.
IBR Execution – Administration
Establishes the framework to conduct IBRs across projects and programs.
IBR Execution – Planning
establish a time-phased plan and schedule for the delivery of artifacts, the tracking of artifact submission, and the status of questions posed in preparation and closeout of an IBR.

2

Risk Analysis

Apply risk analysis engines, and enables review and reporting of risk registers, schedule analysis, and Joint Confidence Level analysis.

Included Applications

Risk Analysis Applications

Applies RiskyProject analysis engine for identification of risk, schedule analysis, Monte Carlo analysis, and cost & schedule analysis. Additionally provides functionality for review and reporting of the risk register, schedule risk analysis, and Joint Confidence Level analysis

  • Filter:
  • Envision Dashboard Apps
  • Envision Data Transformer
  • Proteus Integrator
Integrated Risk Management and Analysis
Extracts Risky Project risk data into Proteus to generate Risk Matrices, Mitigation plans and Risk Properties.
Schedule Risk Analysis
Full quantitative Schedule Risks Analysis with robust modeling and reporting capabilities.
Cost Risk Analysis
Full quantitative Cost Risks Analysis with robust modeling and reporting capabilities.
Sensitivity Analysis
Quickly identify and prioritize activities and risks that require management attention.
Joint Confidence Level
Ability to run a JCL on detailed IMS using both resource rates and or fixed costs as well as analysis on IMS eliminates need to generate a summary model
Heat Maps, Risk Trends, Risk Lifecycle
Identify critical risks. Report on trends in number of risks over time, types of risk, and changes to individual risks.
Risk Mitigation and Response Planning
Ability to plan assign and track mitigation plans through out the risk lifecycle.Ability to integrate schedule with mitigation plans Ability to assess mitigation plan effectiveness vs planned.
Risk Register
Easily import or export data. Then easily score and prioritize risks. Customizable fully to meet your specifications.
Project Portfolio Risk Analysis and Management
Approve, assess, and manage risks at various levels, assess their impact across the organization, create custom reports for different user groups, customize risk assessments and reports for organizational groups.

Advanced IPPM (IPPM/IPMDAR) 

Provides additional functionality to IPPM Repository applications utilizing the greater insight and breadth of data provided by the DoD standard IPMDAR schema.


  • Filter:
  • Envision Dashboard Apps
  • Envision Data Transformer
  • Proteus Integrator
EAC Probability Setup
Input Dashboard Application for the setup, flagging and coding of the probability function in preparation for the EAC calculation process.
EAC Probability Risk Entry and Review
Allows for the entry and review of risks including probability, impacts and linkages to WBS elements for the probability function. Optional application for Probabilistic EAC functionality.
EAC Probability Calculation
Input/validation workspace app for the probability function.
EAC Probability Analysis
Uses statistical modeling to generate probabilistic EAC and ETC S-Curves for projects, allowing organizations to compare them to the Latest Revised Estimate (LRE) and other estimates for a more comprehensive analysis of project costs.

3

Systems Engineering

Integrate elements of MBSE systems. Capture of data from engineering documents and processes including:

  • Requirements management
  • Regulations and standards,
  • Safety and mission assurance,
  • Technical performance management,
  • Framing assumptions,
  • Measures of effectiveness & performance,
  • Key performance parameters/indices,
  • Technical performance measures.

Included Applications

Systems Engineering Application

Series of Envision Dashboard Apps that integrate elements of MBSE systems. This includes capture of data from DOORS, and systems engineering documents

  • Filter:
  • Envision Dashboard Apps
  • Envision Data Transformer
  • Proteus Integrator
Project Design Reviews
Customize design reviews, track deliverables against entrance and success criteria, and track RFAs/RFIs that arise from the reviews.
Contractor Internal Detail Design Review
Designed to create and customize design reviews, track deliverables against entrance and success criteria, and track RFAs/RFIs that arise from the reviews.
Requirements Assessment
Application that Integrates project requirements to regulations & standards, and program management performance.
Technology Assessment
Provides technical details of vision and demonstrator systems and tracks risk, technology readiness level, schedule, and other attributes of the systems by subsystem, allowing quick identification of problem areas.
Regulations & Standards Development and Compliance
An application to support compliance assessments to applicable Regulations & Standards that may impact project technical performance and execution.
Safety & Mission Assurance Analysis
Application to support project Safety & Mission Assurance functions. Can Provide hazard register that lists those hazards identified by engineering personnel.
Integrated Systems Engineering
Comprehensive application that provides real-time review of the status of high-level requirements, highlighting potential problem areas before they can impact schedule.

4

Portfolio, Contract, and Executive Management

From financial analysis and cashflow to facilitating portfolio and organizational overviews these applications are linked with non-traditional business intelligence information geared to higher levels of the customer organization

Included Applications

Contract & Executive Management Application

Designed to facilitate portfolio and organizational overviews of project and program management performance, linked with non-traditional business intelligence information geared to higher levels of the customer organization.

  • Filter:
  • Envision Dashboard Apps
  • Envision Data Transformer
  • Proteus Integrator
Configuration and Contract Management
Integration and configuration of contract deliverables for example Project Control Plans and their evolution through the lifecycle of the project (SEMP, VVP, FOP, IP, PP, Environmental, etc.).
Executive Management & Evaluation
Overall management assessment of project or program execution by key stakeholders and key performance parameters. Includes all facets including cost, schedule, financial, earned value, technical and risks.
Milestone Management and Reporting
Top-level milestone schedule showing time-phasing. Slips and consecutive slips and reasons regarding the slippages are noted.
GAO Reporting
urpose-built Envision Dashboard Application to provide GAO metrics during annual reviews of the project.
Organizational Chart
An application showing the org chart of the project with metadata to relevant personnel data.

PM Financial Analysis Applications

Program and project management focused financial analysis and cashflow. Analysis includes integration of commitments, obligations, and expenditure, and burn-down rates of various types of funding.

Analysis provided within a project or across projects within an organization. Data flows captured from both industry partners/suppliers as well as those within government entity financial management organizations.

  • Filter:
  • Envision Dashboard Apps
  • Envision Data Transformer
  • Proteus Integrator
EFA Project
Visualizations that integrates with data pulled in from BW to show project costs at the Project level.
EFA Program
Application that integrates with data imported from the financial management system (SAP BW or other) to show project costs at the Project level.
Executive Management Financial Report
Summarization of financial execution using standardized report format.
Reporting/Comparison NASA 533 Financial Analysis
An application that summarizes appropriate data from contractors for generation of NASA 533M and NASA 533Q reports and cross references to IPPM/IPMDAR data.
Reporting/Comparison CFSR Financial Analysis
Workspace application that collects financial data to generate the Contract Funds Status Report (CFSR) and provides analysis and predictive analytics of the data underlying the report and cross references to IPPM/IPMDAR data.

Future Portfolio Management Application

Designed to facilitate portfolio and organizational overviews of project and program management performance, linked with non-traditional business intelligence information geared to higher levels of the customer organization.

  • Filter:
  • Envision Dashboard Apps
  • Envision Data Transformer
  • Proteus Integrator
Configuration and Contract Management
Integration and configuration of contract deliverables for example Project Control Plans and their evolution through the lifecycle of the project (SEMP, VVP, FOP, IP, PP, Environmental, etc.).
Executive Management & Evaluation
Overall management assessment of project or program execution by key stakeholders and key performance parameters. Includes all facets including cost, schedule, financial, earned value, technical and risks.
Milestone Management and Reporting
Top-level milestone schedule showing time-phasing. Slips and consecutive slips and reasons regarding the slippages are noted.
GAO Reporting
urpose-built Envision Dashboard Application to provide GAO metrics during annual reviews of the project.
Organizational Chart
An application showing the org chart of the project with metadata to relevant personnel data.

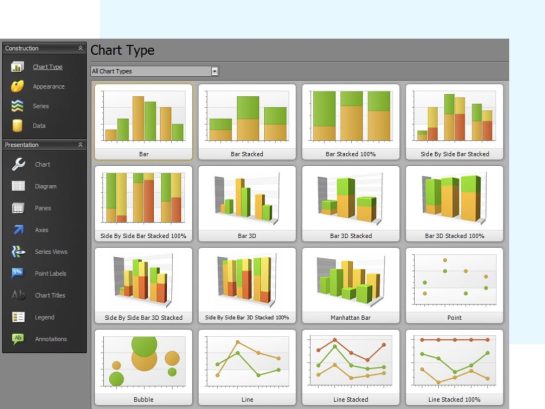
Easily build your own apps

Fine tune and customize any app in our library to your specific needs or build from scratch using our app designer.


Design your own apps and dashboards

Easily create customizable dashboards and gain valuable insights into your project from planning to testing and completion.

“ The SNA purchase price is still approximately 10% less or more than what we paid for the Deltek Cobra solution cost (back) *in 2013*

No Code Required

With a powerful object-oriented administrative layer that accesses data binding, integration, interoperability easily design your data visualizations with drag and drop.

Complex Data made Simple

Create real-time visualization and see changes live on your dashboard. Don’t want to build it yourself? We can help you build out your dashboard per your requirements.

Go from

3 Month

To

0 day

Dashboard Examples:

  • Sales
  • Railway Maintenance
  • Health & Safety Compliance
  • Integrating Systems
  • Earned Value Analysis
  • EVM Compliance
  • Portfolio Reporting
Sales

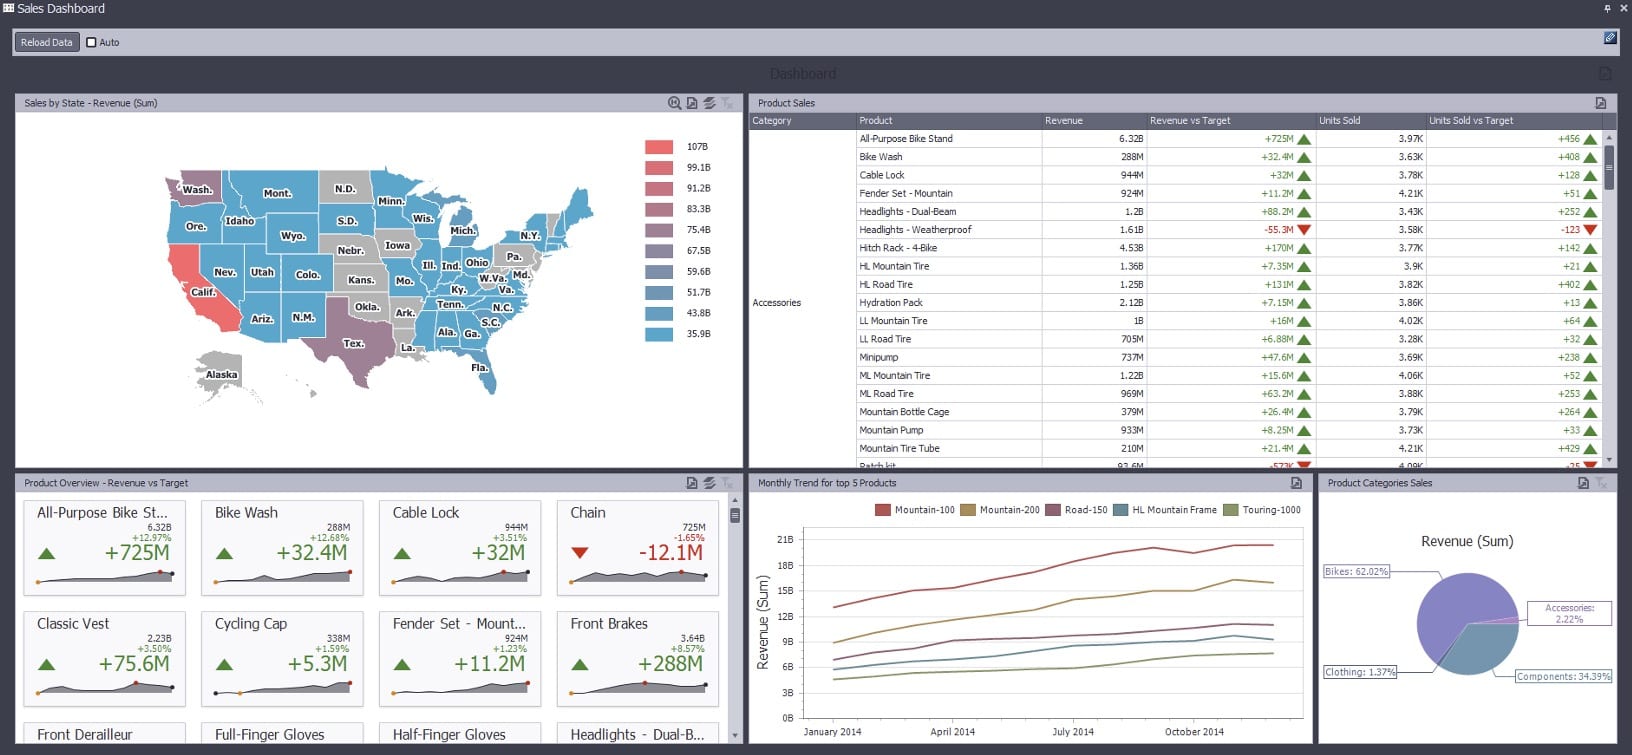
Aggregates sales data within interactive dashboard to show trending and comparison across products, categories and regions of revenue and units sold against targets.  Clicking on state, graph component, card or grid record(s) dynamically updates and filters aggregated data..

Railway Maintenance

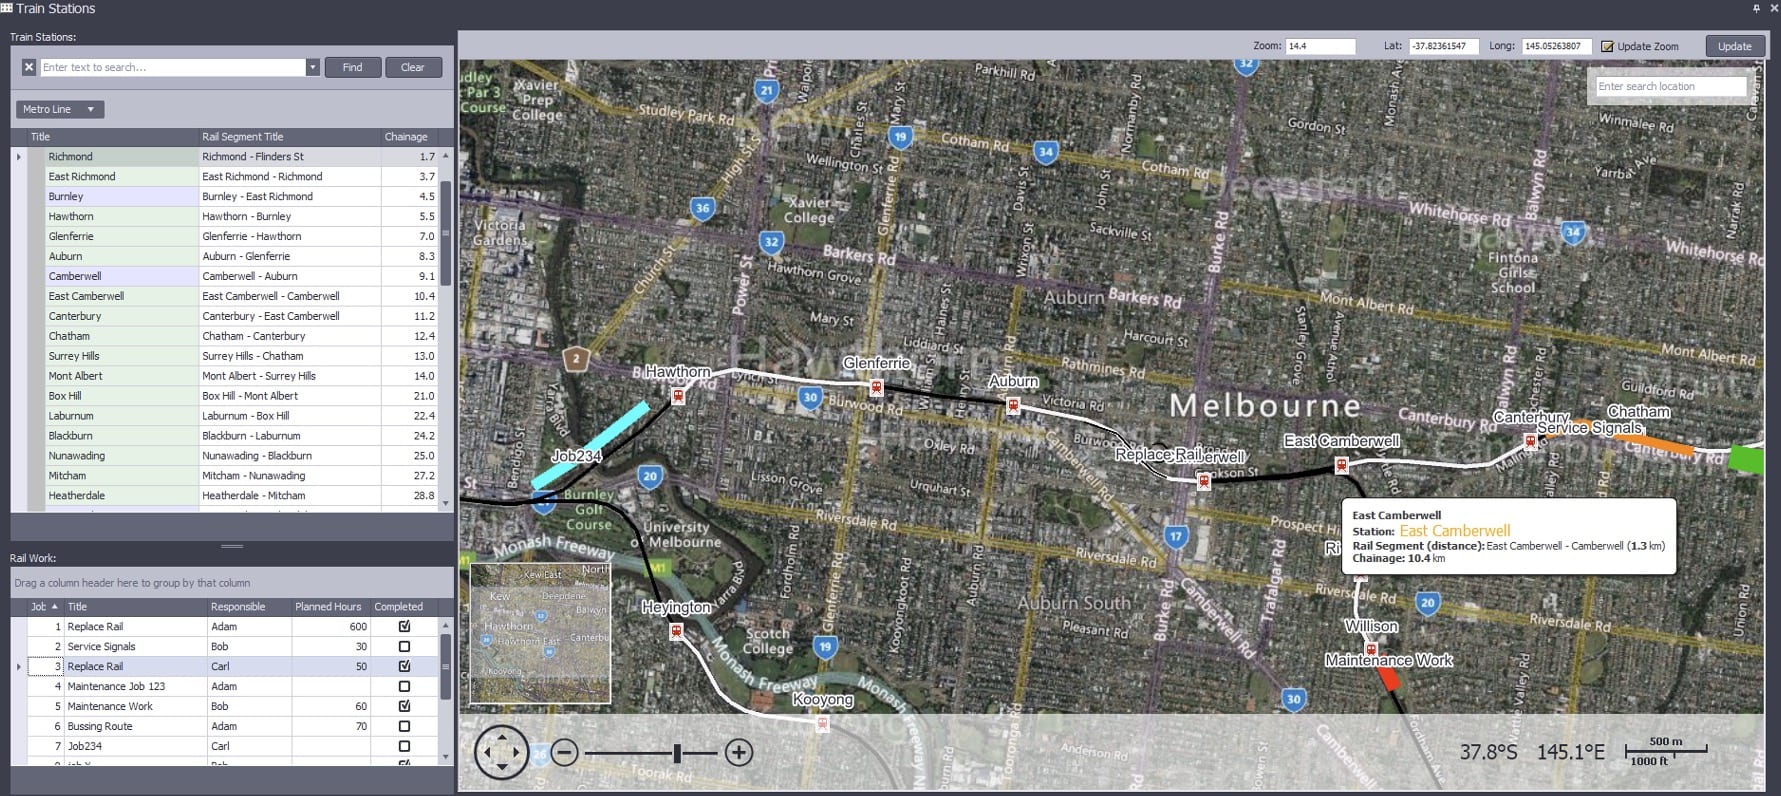
Ties Geographic Information (GIS) to data, in this case train stations as a background overlay on the map and railway maintenance work as a foreground overlay with tooltips.  This can easily be applied to roadways, environmental data sets and oil & gas to integrate any kind of data into a map.

Health & Safety Compliance

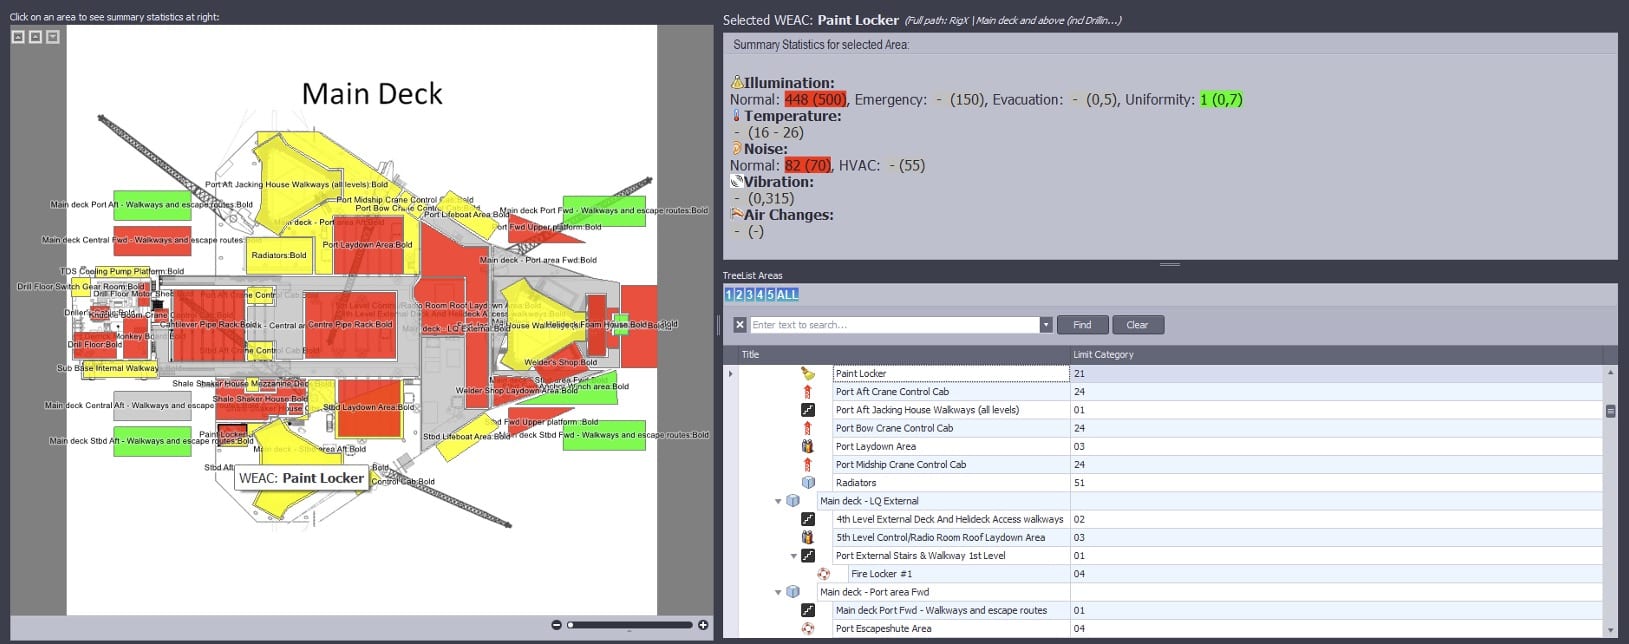
Visually shows health, safety and environmental compliance via color coding on a bitmap schematic, in this case an oil rig platform.  Clicking on that polygon on the image navigates the user to relevant data.

Integrating Systems

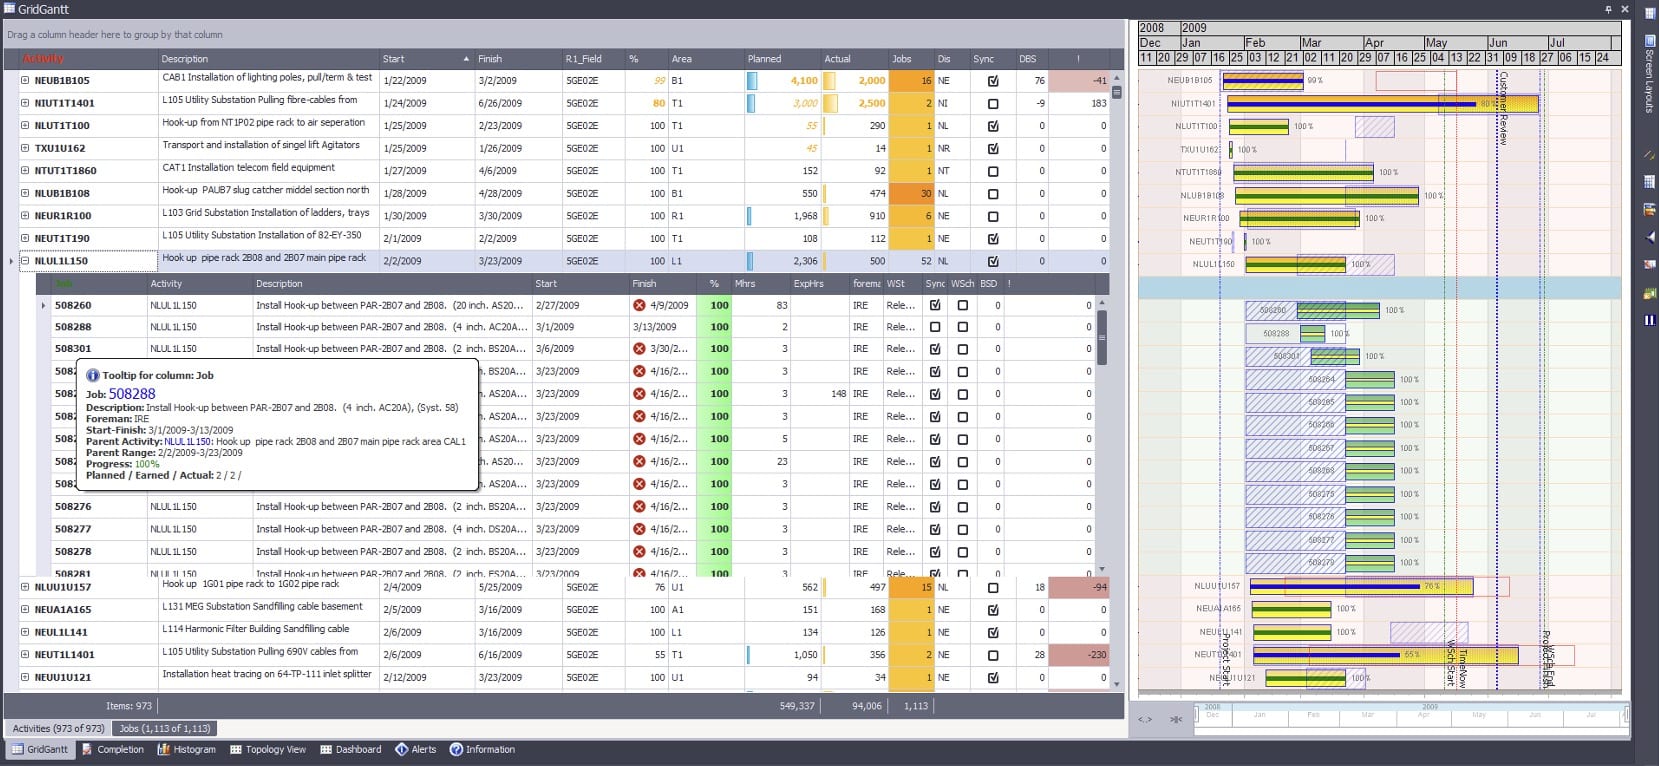
Integrate systems such as schedule data from an Integrated Master Schedule with external systems such as Enterprise Resource Planning (ERP), Quantifiable Backup Data (QBD), supplemental schedules and so forth. Drilling down into a task shows the related records from the external system.

Earned Value Analysis

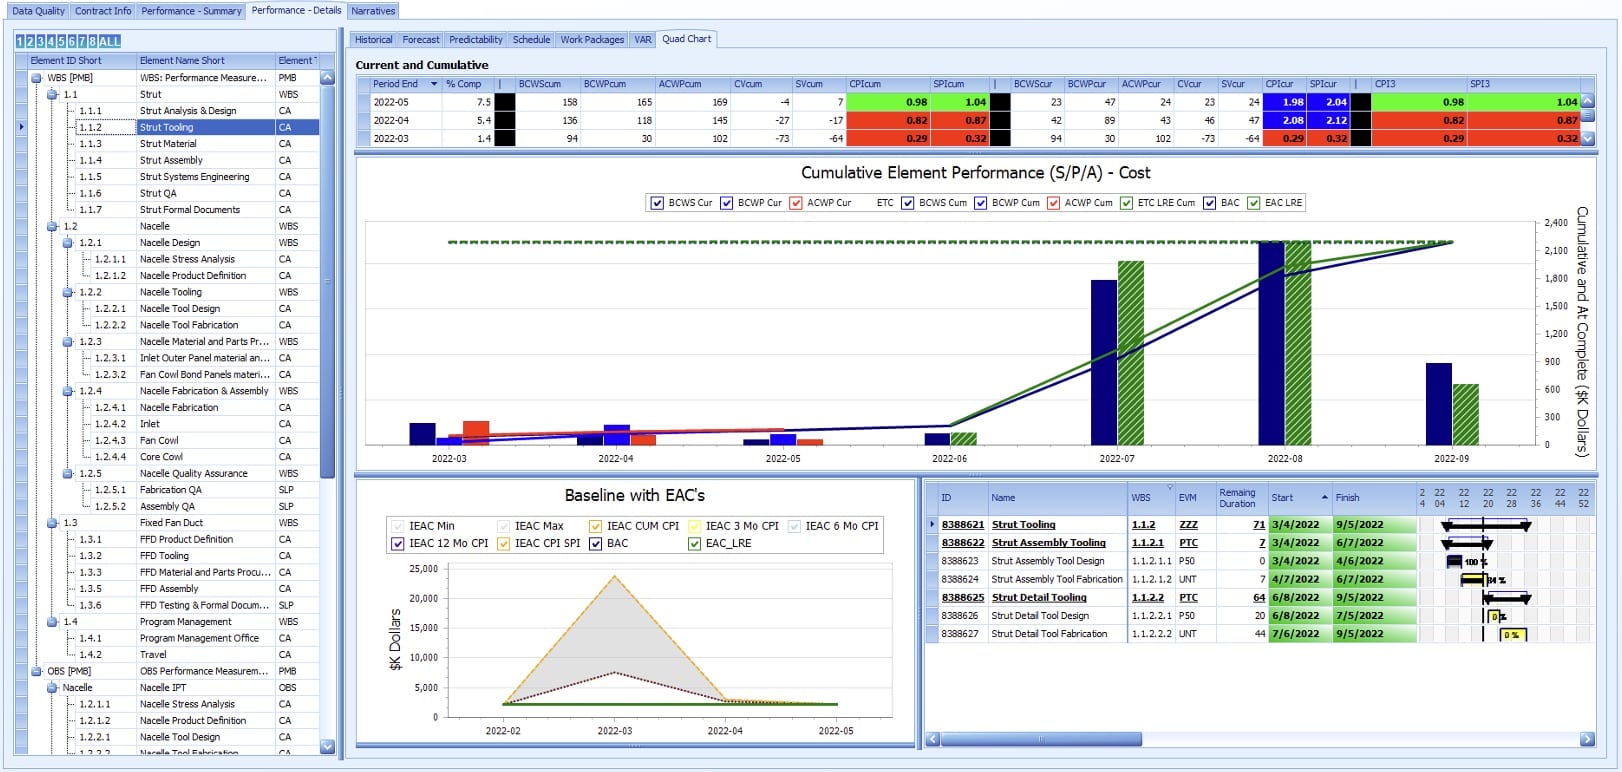
Earned Value performance trending with industry defined metrics integrated with schedule, risk and other datasets utilizing the IPMR Formats and/or the IPMDAR Datasets.

EVM Compliance

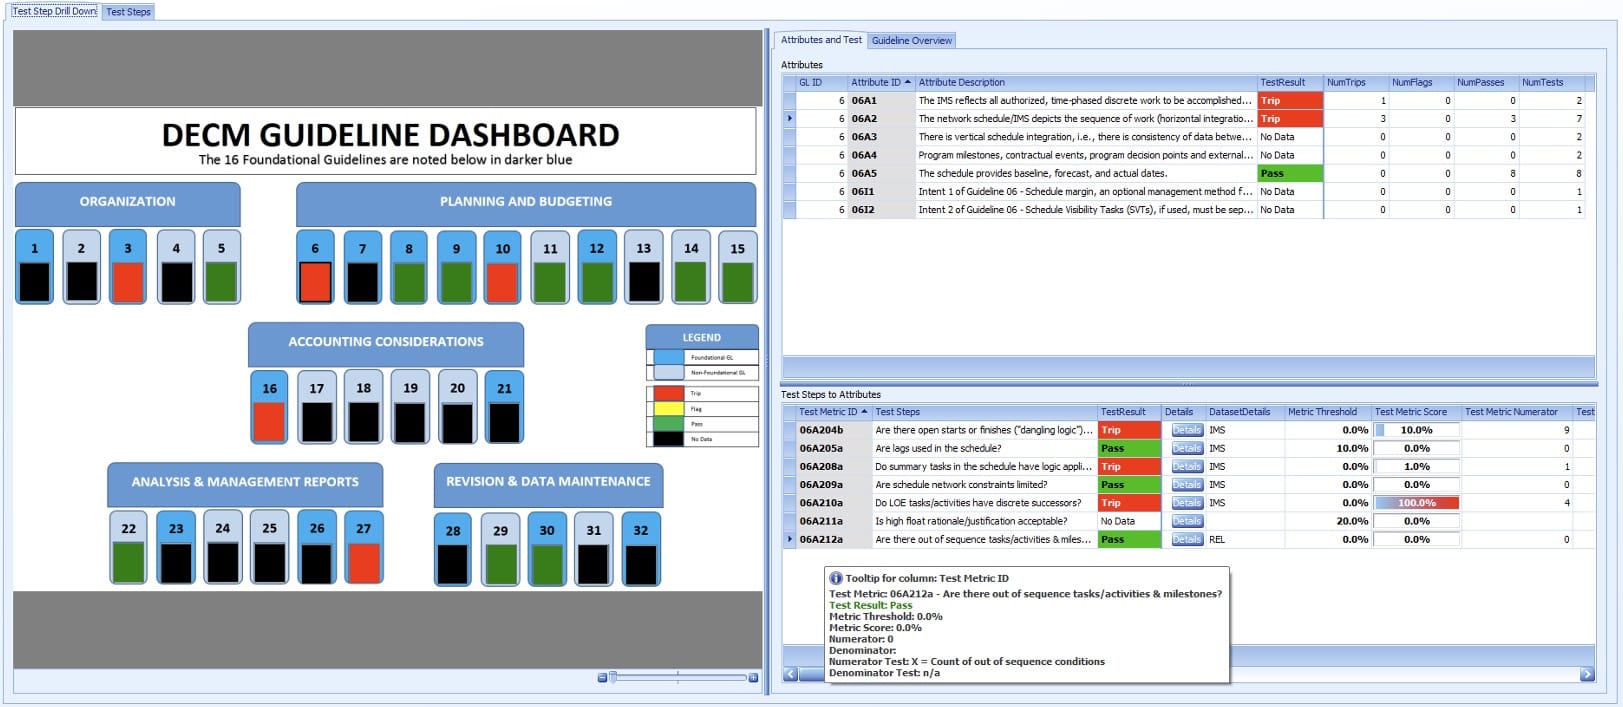
Calculate and report out the DCMA Earned value Compliance Metrics (DECM)

Portfolio Reporting

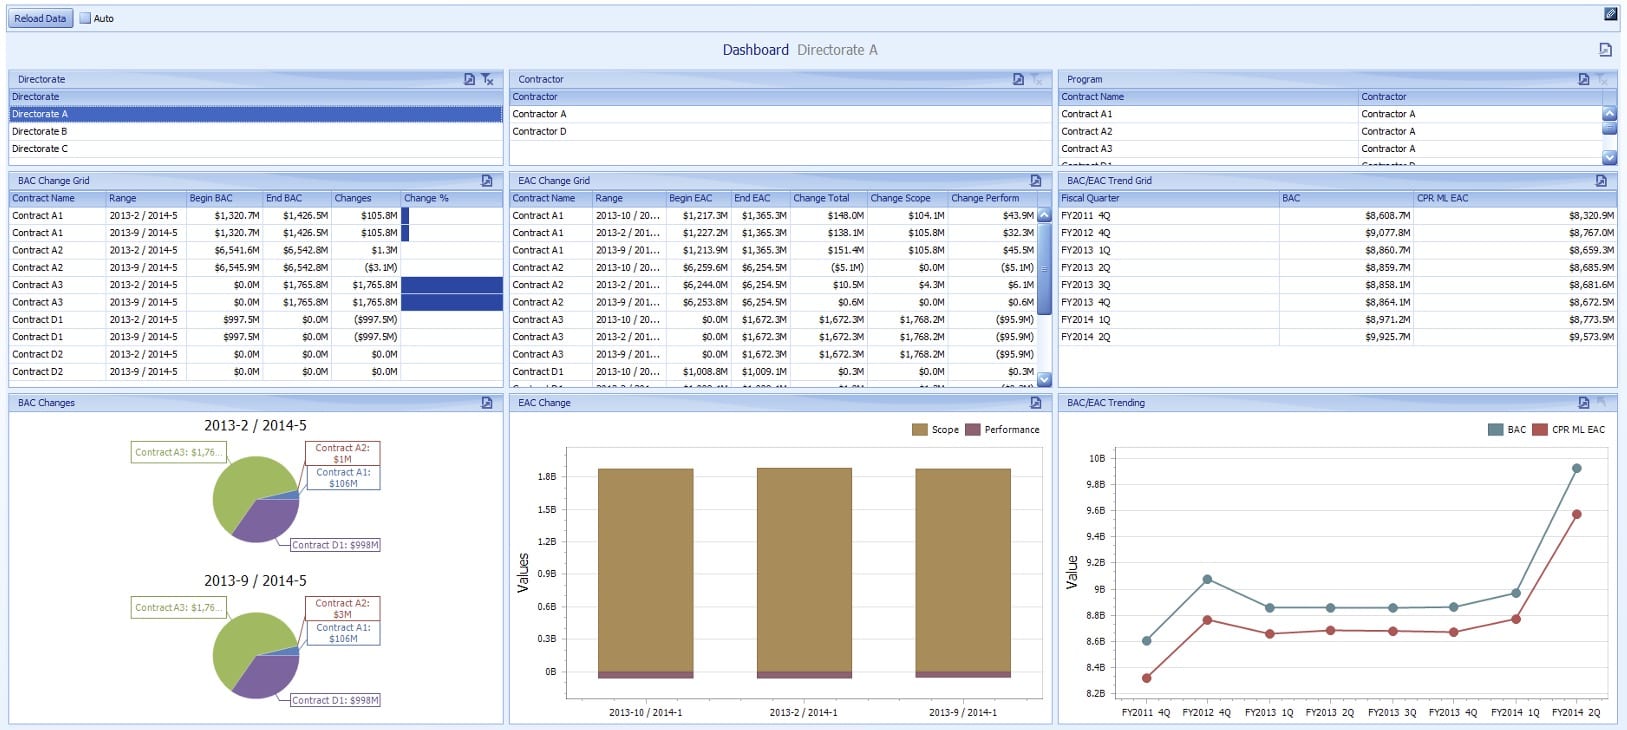
Aggregate project performance data into portfolio’s by programs, contractors, directorates, mission capabilities and so forth.

Leverage the power of AI

Use the power of Artificial Intelligence to create a human readable report that summarizes all key points of your data and calls out important metrics.

Additional Features

White Label

Customize the branding and appearance of the dashboards to match your company brand identity

Data Filtering

Filter data by specific field or meta data. Map fields directly from your data straight to your visualizations.

Automations

Set up automated tasks, notifications and coloring to be alerted if your preset conditions are met.

In Cloud or On Premises

Run locally on premises or scale Proteus Envision easily with our government compliant cloud by TBS

Bad & Corrupt data detection

Detect bad or corrupted data based on the criteria that you specify. Quickly remove it without disruptions.

Compliance Failure Detection

See instantly when something fails compliance and act quickly.

Proteus Envision vs Others

We provide an easily customizable solution right out of the box that utilizes OPEN transparent formats all within one solution. See how we compare to others.

Purchase Once, Use Forever

Say goodbye to recurring fees, Own your software with a single upfront cost. Get ongoing support and updates with our flexible maintenance plans, maximizing your investment and ensuring long-term value.

Lifetime use license

Only pay for packages you need

Annual support and maintenance are optional

Custom implementation available

Want to see more?

Get in touch with one of our solutions experts for a demo and see how quickly we can unify your data

Learn How To:

How to save over 35% in

cost to the government

Save 66% over 3 years with

our perpetual license model.


Connect with us

Questions and Answers

Don’t see your question? get in touch.

How long does it take to implement the out-of-the-box Envision Dashboard Apps?

Within a couple of hours, the Proteus client application can be installed, the database schema(s) created, repository folder(s) updated with your organization's specific connection parameters, users and groups defined and the first import of data ready for analysis.

Why are there so many available turn-key Envision Dashboard Apps?

The openness and ease to create and maintain Dashboard Apps with Proteus Integrator facilitates the development of so many turn key solution.  This allows the solutions to be tailored for specific project management domains such as cost analysts, schedule analysts, earned value management analysts, systems engineering, risk management and so forth as well as the integration across those domains for a complete picture for project managers and executive management.  From a single source of truth and platform, solutions can be fine-tailored for groups of users to support what they need to see for their job functions.

Can my organization modify or extend the functionality of Dashboard Apps?

Yes, absolutely and that is encouraged.  Proteus Integrator admins can modify the configurations for any Dashboard App that they have permission to do so in terms of sources of data, calculated fields and user interface controls, and those changes are immediately pushed out to the end users when the repository is published.  They can also create new, or merge, Dashboard Apps as needed.  The Proteus end users can further customize the views, layouts, dashboard, reports etc. centrally for the organization or just for their personal use.

Can I share the loaded data and Dashboard App with external stakeholders?

Yes, often times the data loading into Dashboard Apps is internal to an organization in their enterprise databases or local files that external stakeholders and customers don’t have access to.  Proteus has the ability to create a Container, which persists that live data with the configuration of the Dashboard App, that can be sent to other users as long as they have Proteus to open it and the access rights to view it.  Ultimately, the receiver of the Container will see exactly what the user who created it in the live environment saw.